
Shanghai Metals Market's public first-half 2026 sulfur chain review, dated 6 July, framed Canada as a critical swing supplier after Hormuz disruption and CIS export restrictions. The 21 August desk note is a reread of that same public article, not a new customs print. The source is at https://news.metal.com/newscontent/103989791-smm-analysis-h1-2026-sulfur-industry-chain-review-extreme-volatility-under-supply-shocks.
The review cited StatCan-style national export tonnage growth and elevated Vancouver FOB levels in early 2026. In the fuller H1 account SMM later quantified, 2025 Canadian sulfur exports were 4.25 million tonnes, up 40.7 percent, with first-four-month 2026 value already $1.049 billion, annualized near 5.22 million tonnes. Alberta and British Columbia account for more than 95 percent of that national export account.
Swing supplier, in that usage, means Canada filled tonnes that Middle East dry bulk and CIS rail could not. It does not mean Canada became the largest seaborne origin. BC Insight's 23 March oil-sands note still ranked 2025 Canadian exports third, behind the UAE and Saudi Arabia, at about 4.57 million tonnes, with oil sands contributing about 3.0 million tonnes of a 4.7 million tonne national output.
FOB Vancouver in the SMM H1 path rose from about $500 per tonne in January toward $825-950 per tonne by April. Those are public trade-press figures, not a licensed weekly grid. Argus open news on 13 July separately put Tampa Q3 molten at $705 per long ton delivered (https://www.argusmedia.com/en/news-and-insights/latest-market-news/2851577-tampa-3q-liquid-sulphur-price-hits-record-705-lt) and US Gulf spot solids at $1,100-1,150 per tonne FOB. Pacific and Atlantic North America both rerated. They did not print the same number.
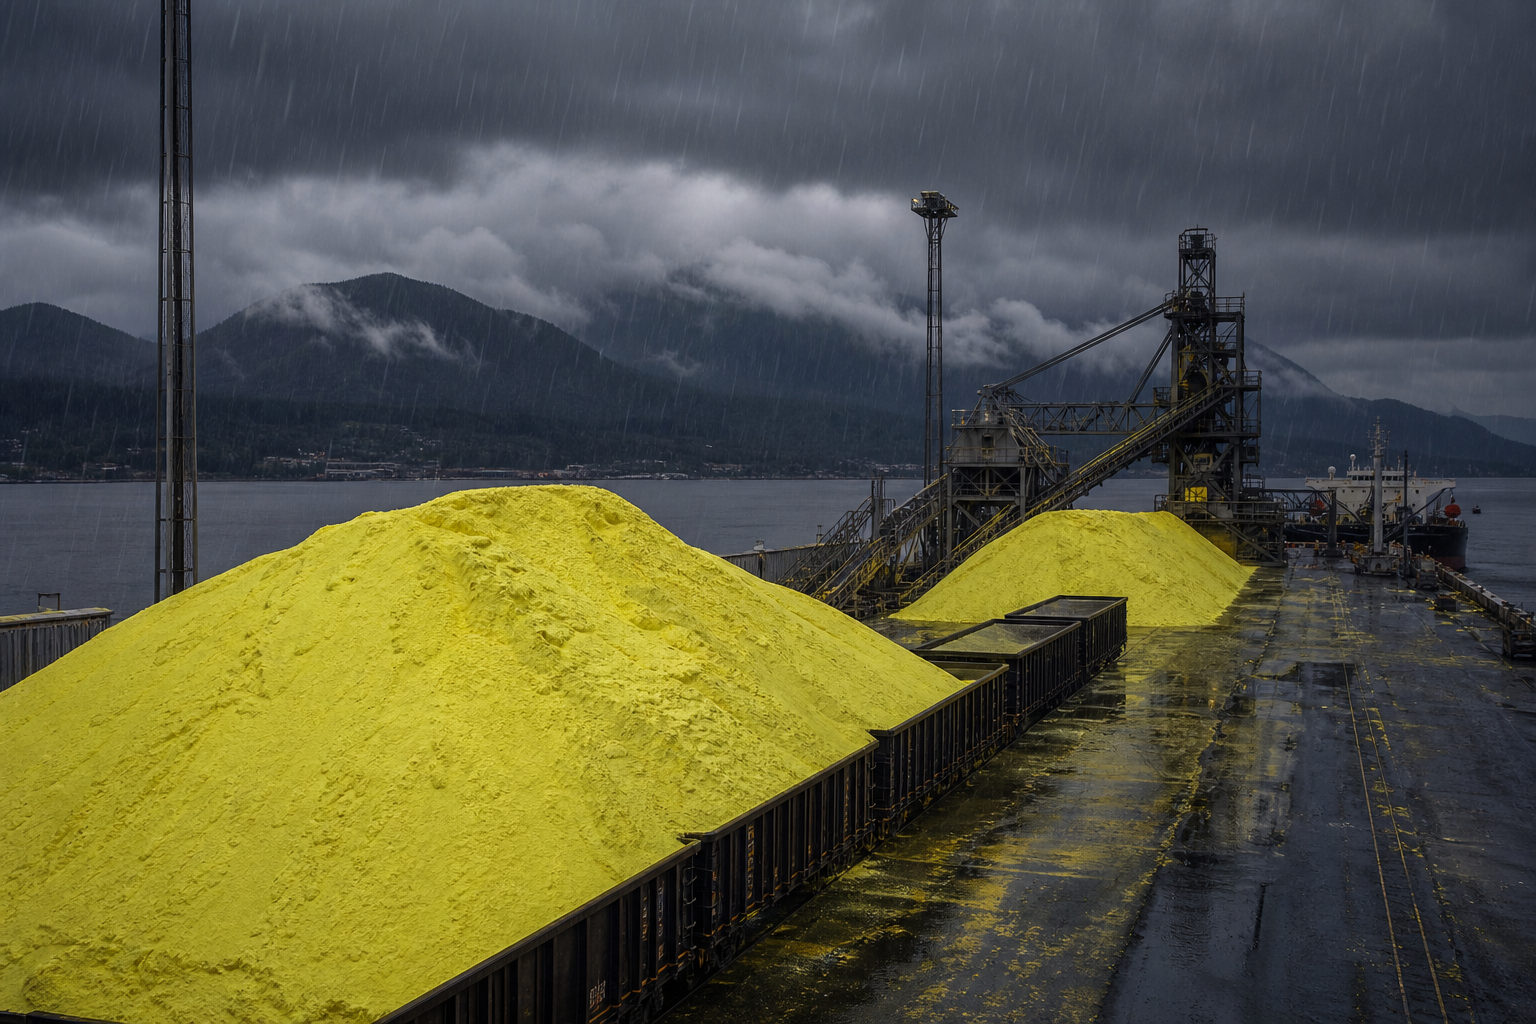
Port of Vancouver's own 2025 Statistics Overview put sulphur at 3,507,428 tonnes, up 5 percent. That verified_public port line is the stem underneath SMM's national annualized pace. Forming plants, unit trains, and tidewater loaders set whether Alberta blocks become those tonnes. AIS and FOB commentary do not.
Russia's industrial sulfur export ban was extended to 31 December 2026 by Decree No. 785 on 25 June. Kazakhstan Ministry of Energy Order No. 1363 fully suspended sulfur exports from 27 June, with a narrow exception for shipments to Russian railway stations. Those CIS closures are the other half of the swing-supplier assignment. Hormuz is the first half.
China's first-half 2026 sulfur imports, in SMM customs analysis, fell 57.7 percent to about 2.26 million tonnes, and South Korea, Oman, and Canada rose to a combined 58 percent of China's import mix as Gulf-4 share roughly halved. Canada as a China origin is therefore a mix shift, not a volume boom into a booming Chinese bid.
Alberta inventory remains the buffer. Argus, citing AER, put provincial stock at 11.66 million tonnes in July 2025, the lowest since May 2019. CRU expected about 1.5 million tonnes of blocked Canadian sulfur to be remelted across 2025-2030 as additional remelt capacity commissions by end-2026. High FOB is what pays remelt, rail, forming, and terminal charges often cited above $150 per tonne.
The 21 August reread does not add a new tonne. It keeps the H1 frame on the desk while June customs, Tampa Q3, and the 22 August tariff watch accumulate around it. Canada is still the Pacific answer to a Gulf hole that CRU said was still more than 1 million tonnes a month as of March-July.
Context only. Figures follow the named SMM public review and the government and port prints already on the file. Licensed Argus and Platts weekly assessment grids are not restated here.